

01Were you there?
We can test a past event without having watched it.
Someone asks me: were you standing there when the Big Bang happened? No. I was not there when a mountain formed either. The serious question is whether a proposed history explains evidence that survives now.
A wet road alone does not establish a storm. A burst pipe can wet it too. Rain gauges, weather records and water spread across an entire region make a different case. Several clues can separate explanations that one clue cannot.
Cosmology means studying the universe on its largest scales. Its evidence includes the wavelengths of light, how distant events unfold, microwave radiation across the sky, and the proportions of light elements. These are measurements with instruments and errors, not memories of creation. [1] [32]
I will explain what is actually measured before asking what follows. I will also keep unresolved questions visible. Saying scientists know everything would be a lie. Saying they know nothing because they do not know everything is another lie.
If someone proposes God, Allah or Bhagwan as the explanation, the proposal still needs its own support. Disliking a scientific model does not establish a particular religious account. We can examine both claims without pretending either has already won.
02Which Big Bang do you mean?
A hot early universe is not a complete account of existence.
The phrase Big Bang gets used for several different ideas. Someone hears it and pictures a bomb exploding into darkness. Someone else means the universe appearing from absolute nothing. Neither picture states the core observational claim carefully.
The hot Big Bang model describes an earlier universe that was much hotter and denser, followed by expansion and cooling. It connects that history with observations. It does not, by that statement alone, explain why anything exists. [1] [2]
Inflation is a proposed very early period of accelerated expansion. A singularity is what appears when certain classical equations are pushed to a limit where they stop giving a usable description. Those are different issues from whether the universe passed through a hot, dense phase.
The standard cosmological model adds particular assumptions about geometry, matter and dark energy. Some detailed assumptions may change under better observations. Their evidential status is not identical to the status of every observation they help explain. [32]
So I ask a critic to identify the target. Are we discussing expansion, early heat, a particular estimate of age, inflation, or an absolute beginning? A criticism aimed at one claim cannot quietly be presented as a refutation of all five.
03Light carries a pattern.
An astronomical spectrum is more than a colourful photograph.
Spread light into its wavelengths and you get a spectrum. Wavelength is the spacing between successive crests of a wave. Visible red light has a longer wavelength than visible blue light. Our instruments also measure light outside the range our eyes see.
Atoms absorb or emit particular wavelengths under particular conditions. Several such features make a recognisable pattern. A telescope collects light, and a spectrograph separates it so researchers can compare those features with laboratory measurements. [3]
This resembles recognising a tune even when it is played at a different pitch. The comparison helps explain the idea. A real spectrum is identified by measured features, their relative positions, the instrument's calibration and competing explanations, not by a musical resemblance.
Dust, noise, overlapping lines and the source's physical conditions can complicate identification. A single faint bump can be ambiguous. Multiple compatible features and follow-up observations make the inference stronger. Brightness in a few filters is not always a substitute for a resolved spectrum.
I do not have to accept a galaxy's distance because its photograph looks impressive. I can ask which features were identified, what wavelengths were measured, and what uncertainty remains. That turns a picture caption into a chain of evidence we can discuss.
04What does redshift measure?
The number describes a wavelength ratio before it describes a history.
Redshift means an identified feature arrives at a longer wavelength than its reference wavelength. Astronomers call the amount z. To calculate it, divide the observed wavelength by the reference wavelength and subtract one. The ratio itself is a measurement. [3]
Take an invented example. A feature known at 500 nanometres is measured at 750 nanometres. Divide 750 by 500: the result is 1.5. Subtract one and z equals 0.5. A nanometre is a very small unit of length used for wavelengths.
That calculation does not automatically supply a distance, an age or a speed. Those require an interpretation and, for large cosmological distances, a model of the expansion history. Writing z on an axis is not permission to hide those extra steps.
Motion can shift light. Gravity can shift light. Cosmological expansion also produces a wavelength shift. Nearby motions add to or oppose the broader expansion pattern. It would be wrong to call every redshift cosmic expansion simply because the same word appears. [7]
The useful question is which explanation accounts for the whole set of observations. The universe is not diagnosed from the redness of one object. We need distances, patterns across many sources, and tests beyond wavelength alone.
05How far away is it?
Do not infer expansion by first assuming every distance from redshift.
Someone objects: you use redshift to calculate distance, then use distance to prove redshift shows expansion. That would be a circular demonstration. The basic nearby relation needs distance estimates that do not simply assume the relation being tested.
Parallax is a geometric method. Observe a nearby star from different positions in Earth's orbit and measure its small apparent shift against more distant objects. Knowing the observing baseline lets us infer distance. Real measurements need instrument corrections; Gaia's parallax biases are explicitly studied. [6]
Cepheid stars brighten and fade repeatedly. Leavitt's work identified a relationship between their periods and brightnesses. To turn that relationship into distances, its absolute scale must be calibrated and effects such as dust must be handled. The period alone is not a magical ruler. [5]
These methods connect to brighter objects visible farther away, including calibrated Type Ia supernovae. A supernova is an exploding star. The distance ladder means overlapping methods tied together, with uncertainty and possible systematic errors passed between steps. [23]
At much greater distances, astronomers do use cosmological models to interpret redshift. That is legitimate if stated. It is different from claiming every published distance is an independent proof of the very model used to calculate it.
06What did Hubble establish?
The early result mattered; its original numerical scale was wrong.
Hubble's 1929 paper compared distance estimates and radial velocities for external galaxies, then called nebulae. Many of the spectral measurements came from earlier work, especially Slipher's. The history is a collective chain, not one man inventing every observation. [4]
The result showed a broad tendency for more distant systems to have larger recession velocities, with substantial scatter. Hubble's early distance scale produced an expansion rate much larger than modern estimates. Keeping that error visible makes the history more accurate, not less scientific.
For suitable nearby distances, the relation is often written as recession speed equals Hubble parameter times distance. The Hubble parameter describes the expansion rate at a given time. Its present value is called H-zero. The simple speed formula is not the full rule at every redshift.
Individual galaxies also move within groups and clusters. Such motions can dominate nearby cases, producing exceptions to a neat outward trend. Gravity can keep a group together while the large-scale pattern still expands. [7]
The argument therefore does not rest on Hubble's original numbers being sacred. Better calibration, more objects and additional tests matter. I want the case that survives correction, not a polished legend that pretends the first graph was already perfect.
07Distances can grow.
The large-scale description is not a rule that stretches every object.
In the standard description, freely moving locations carried with the large-scale cosmic flow become farther apart as the scale of the universe grows. Light travelling between them is stretched too. This connects the wavelength ratio with the change of scale. [7] [32]
Imagine marks printed along an expanding strip. Separations between marks grow. The example explains proportional change. A physical strip, its material, an outside room and the hand stretching it are not ingredients automatically required by the cosmological equations.
The model does not say your chair, Earth and every atom grow at the cosmic rate. Bound systems have their own dynamics. Electromagnetic forces and gravity can maintain structures while sufficiently large separations follow the expansion history.
Nor does a galaxy have to be a little rocket racing through a pre-existing empty room. Motion through nearby space and the changing large-scale separation described by the model are related but different ideas. Mixing them creates several popular objections.
We can reject a bad analogy without rejecting the measured relationship it was meant to explain. The proper test is whether the mathematical description predicts observations, and whether an alternative does better with equally explicit assumptions.
08Where was the explosion?
A uniform expansion does not single out Earth as its centre.
If distant galaxies tend to recede from us, are we at the centre? Not necessarily. In a uniformly expanding arrangement, an observer at another ordinary location would also see sufficiently distant locations separating. The relation does not choose one privileged central observer. [1] [7]
Take three equally spaced marks. Double every separation. From the middle mark, the outer marks move away. Describe the same change from an outer mark and the other separations also grow. The arithmetic does not require the middle mark to be the origin of everything.
The Big Bang was not an explosion at one address inside an otherwise unchanged universe. In the model, the region that became our observable universe was once hotter and denser throughout. The microwave background therefore does not have to arrive from one point in the sky.
What is the universe expanding into? The description of changing internal distances does not itself require an external container. Whether a larger embedding or a deeper theory exists is a separate question. The balloon analogy's surrounding room is not evidence for one.
We also do not know the total size or global shape merely by measuring our observable region. An observable limit is not a discovered wall. I will not turn a useful drawing into information the observations never supplied.
09Does light merely get tired?
An explanation of colour must also face the timing evidence.
An alternative says light loses energy on its journey, so it becomes redder without expansion. Calling this tired light does not specify a complete physical mechanism. It must explain the other observations too, rather than borrowing the redshift alone and stopping there.
Cosmological expansion predicts stretching in observed time intervals as well as wavelength. Under the standard relation, an event lasting twenty days in its source's frame would be observed over thirty days at z equals 0.5, or forty days at z equals one. These are calculated examples. [7]
White and colleagues analysed 1,504 Type Ia supernova light curves. Their 2024 study found a redshift-dependent stretching exponent of 1.003, with statistical uncertainty 0.005 and systematic uncertainty 0.010, consistent with the expected exponent one. [8]
The comparison accounts for observed bands and assumes comparable emitted light-curve durations; populations and selection can matter. It is an observational analysis with checks and limits, not a stopwatch that floated beside each exploding star.
A simple model that reddens light without stretching the events fails this test. That does not logically refute every imaginable alternative. An alternative must state its own timing mechanism and also explain the remaining evidence. Adding a name is not doing that work.
10Why look for cold radiation?
A hot past leaves a testable expectation after cooling.
A universe once filled with hot radiation should not simply forget that radiation. Expansion stretches its wavelengths and lowers its temperature. A very old afterglow can therefore be cold today, even though the earlier universe was hot. [2] [32]
The idea preceded the famous discovery. In 1948, Alpher and Herman estimated a present background temperature of roughly five kelvin. That was not today's precise value. It was a physical prediction that relic radiation should remain, with an imperfect early estimate. [11]
Kelvin is an absolute temperature scale. Zero kelvin is absolute zero; around three kelvin is extraordinarily cold by everyday standards. Cold does not mean no radiation. It means the spectrum is concentrated at much longer wavelengths than visible light.
In 1965, Penzias and Wilson reported excess antenna noise corresponding to about 3.5 kelvin, with a one-kelvin uncertainty, at their observing frequency. Dicke and colleagues discussed the cosmic interpretation in a companion paper. [9] [10]
That first measurement did not settle every issue about the signal. Its direction, spectrum and possible local sources required further investigation. The strong case comes from what later observations established, not from treating one unexplained noise reading as instant proof of an entire cosmology.
11Noise alone is not enough.
Measure the shape across frequencies.
The cosmic microwave background, or CMB, is radiation observed across the sky. Its average spectrum closely follows a blackbody curve: the particular distribution of radiation expected from matter and radiation in thermal equilibrium at one temperature. It is a very specific shape. [12]
Blackbody here does not mean a black solid hanging outside the universe. It names a measurable radiation spectrum. Hotter and colder blackbodies have different curves. A random microwave signal need not have that form.
COBE's FIRAS compared sky radiation with a reference calibrator across many frequencies. Researchers modelled foregrounds, including our Galaxy's emission. The published spectrum is a calibrated result, not untouched detector voltages. [12] [13]
Calibration needs scrutiny, not automatic suspicion. Arbitrary or hidden corrections would be a problem. Instrument design, procedures, foreground models, uncertainties and cross-checks let us examine the actual choices.
Fixsen's later temperature assessment gives about 2.7255 kelvin, with uncertainty around 0.0006 kelvin. The plotted archive uses a 2.725-kelvin reference. These are related results for different purposes, not identical numbers. [14]
12How close is the curve?
The remaining differences should be visible, not hidden by a thick line.
The NASA archive provides forty-three frequency bins for the FIRAS monopole product. Monopole means the sky's average component; it does not mean the small hot-and-cold map. The file includes a spectrum, residuals, quoted uncertainties and a modelled Galactic component. [13]
Its documentation states how the spectrum column was made: a 2.725-kelvin blackbody plus the published residuals. A residual is the difference remaining relative to the reference. Describing the column as raw, assumption-free brightness would misrepresent the product.
The figure after this section shows both the broad curve and those residuals on a much more sensitive scale. The near-perfect agreement on the upper plot alone can hide the small differences that scientists actually examine.
The bars show the archive's one-standard-deviation uncertainty scale, not guaranteed bounds on truth. Errors in different frequency bins can be linked; that linkage is covariance. I have not recalibrated the instrument or calculated a new fit significance without that full error information.
This spectrum strongly supports a thermal radiation background when considered with the measurement analysis and other evidence. It does not independently establish an absolute beginning, an inflation mechanism or a particular deity. Forty-three useful numbers are stronger than a slogan, but they are not permission to claim everything.
Measured spectrumThe curve and the differences.
COBE/FIRAS: the archived calibrated product, with its residuals visible.
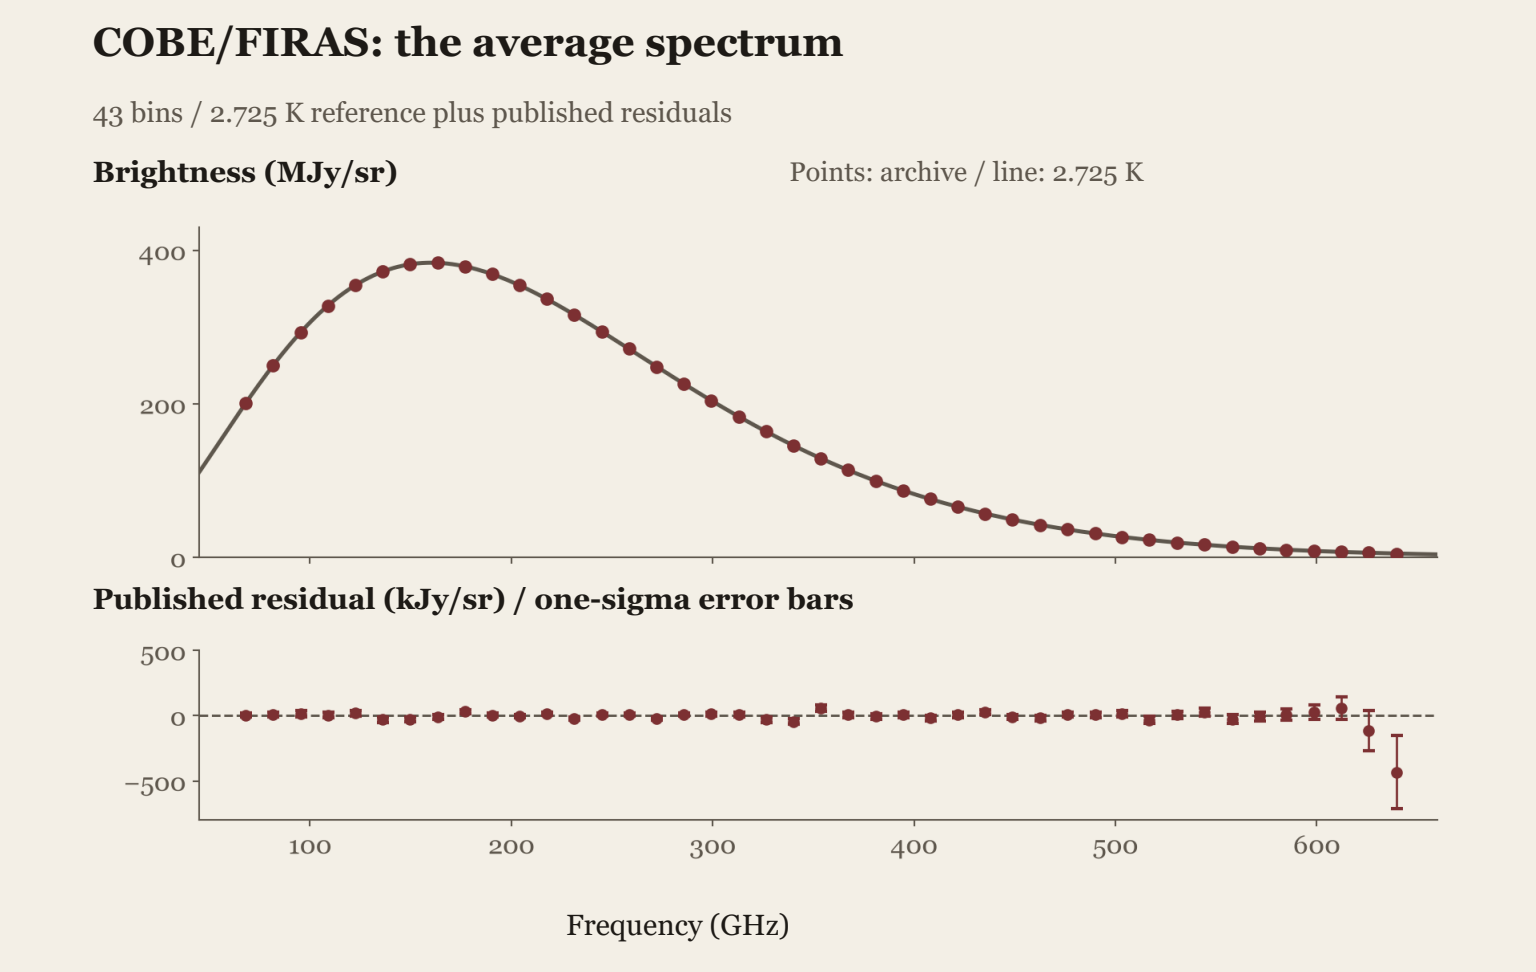
The reference is a 2.725 K blackbody. The archive explicitly constructs the upper spectrum as that reference plus the residuals. These are calibrated published values, not new observations or raw detector output. Frequency was converted from inverse centimetres to GHz. [12] [13]
These are spectral-brightness units: the lower panel uses kJy/sr; the upper uses MJy/sr, a thousand times larger per unit. The bins may be correlated. The drawing and CSV supply no fresh calibration, full covariance analysis or new probability that the entire cosmology is correct.
Download the plotted values and provenance
13The CMB is not time zero.
An opaque early universe limits what ordinary light can show us.
The early universe contained a hot plasma: matter with many electrons separated from nuclei. Light scattered repeatedly from free electrons. It could not travel freely across the universe as it does through much of space today. [2] [32]
As conditions cooled, electrons and nuclei formed neutral atoms. The universe became much more transparent. The CMB we observe mostly last scattered around this transition, roughly 380,000 years into the standard expansion history. It was already an evolved universe, not the first instant.
The term recombination is used for this transition even though it concerns the first widespread formation of those atoms. It was a gradual physical process, not a switch flipped everywhere at one perfectly sharp second.
A fog clearing gives a useful comparison: light from beyond an earlier opaque region cannot simply reach us unchanged. The comparison is not a claim that the early universe was made of water droplets or that the CMB is a solid shell around Earth.
We infer earlier conditions using other evidence and physics. We do not possess a photograph of absolute creation because a microwave sky map exists. A scientific result becomes easier to defend when we stop making it carry claims outside its actual reach.
14The small patches matter.
The average spectrum and the sky map answer different questions.
The CMB is almost uniform, but not exactly. After separating major contributions such as our motion and foreground emission, instruments measure tiny directional temperature variations. These are called anisotropies: differences with direction. [15]
Before light travelled freely, gravity and pressure affected the coupled matter-and-radiation mixture. Disturbances left characteristic patterns on different angular scales. The relative positions and heights of those patterns can test a model of the early universe.
An angular scale tells us how large a pattern looks in the sky. It is different from the frequency axis on the previous spectrum. A smooth average spectrum can coexist with small variations in different directions. Confusing these two plots confuses two different tests.
Planck measured temperature and polarisation, the orientation pattern of light's electric field. ACT's 2025 DR6 analysis used another telescope and observations at finer angular scales to test the same framework. Foregrounds and calibration remain part of both analyses. [16]
Independent instruments strengthen the case, though analyses may share assumptions or combine datasets. I will not call every combined result independent. The question is which observations and checks are separate, and how much the conclusion changes when those choices change.
15Was the background hotter?
A cooling story should face measurements away from our present location.
The standard expansion picture predicts that the background temperature increases with redshift in proportion to one plus z. Today it is about 2.725 kelvin. At z equals one, the prediction is about 5.45 kelvin. That is a calculated expectation, not a new measurement. [32]
How could anyone measure a background temperature in the distant past? Certain atoms or molecules absorb and emit radiation in ways that depend on the radiation surrounding them, as well as local physical conditions. Their spectra can constrain that environment.
Riechers and colleagues used water absorption in a galaxy at redshift 6.34. Their 2022 analysis reported a background temperature range of 16.4 to 30.2 kelvin at the stated one-sigma level, compatible with the standard expectation of about twenty kelvin. [17]
This is not a thermometer lowered into empty ancient space. It uses observations and a physical model of the gas and radiation. The wide interval and environmental assumptions belong in the explanation, rather than being removed to make the result sound more dramatic.
The importance is the test's direction: a background expected to have been warmer is constrained to have been warmer in a distant system. One result does not prove every detail of cooling history, but it supplies another place where an alternative explanation must do real work.
16The first minutes made nuclei.
Making nuclei is different from making complete atoms or stars.
An atomic nucleus is the central collection of protons and neutrons. Electrons around it make an atom. During the first minutes of a hot expanding universe, nuclear reactions could make light nuclei long before widespread neutral atoms formed. [18]
Hydrogen nuclei are mainly individual protons. Some protons and neutrons formed deuterium, a heavy form of hydrogen. Reactions also produced helium nuclei and much smaller amounts of other light nuclei, including material that becomes lithium.
The calculation uses nuclear reaction rates, particle behaviour and an expansion history. It predicts proportions rather than saying a hot event can make anything at all. The density of ordinary matter affects those predictions. Cooling eventually limits further reactions.
Stars later make additional elements and alter the light-element inventory. Therefore, measuring a random modern cloud is not automatically measuring the primordial mixture. Primordial means associated with the early universe, before later processing substantially changed it.
The useful test compares early-universe calculations with carefully chosen systems and models for later effects. It is not a spoonful of ancient soup stored untouched in a museum. The inference is harder than that, and specific enough to be checked and criticised.
17How much deuterium is there?
Its absorption lines allow a quantitative test in nearly pristine gas.
Deuterium has a proton and a neutron in its nucleus; ordinary hydrogen has just a proton. Their spectral features are slightly displaced from one another. Astronomers can use absorption in the light of background quasars to estimate their relative amounts. [19]
A quasar is a bright distant source powered by an active galactic centre. Gas in front of it removes particular wavelengths. The analysis must distinguish deuterium absorption from ordinary hydrogen at a different velocity and account for the gas's structure.
Cooke, Pettini and Steidel combined seven carefully analysed systems in their 2018 study. They reported about 25.27 deuterium nuclei per million hydrogen nuclei, with quoted uncertainty about 0.30 per million. That is the ratio written in ordinary numbers. [19]
It is a specific estimate from a selected sample, not a count of every hydrogen nucleus in the universe. The choice of low-processed gas, line modelling and consistency between systems matter. Precision does not remove the need to inspect the method.
The payoff comes from comparison. A matter density inferred from deuterium and nuclear physics can be checked against the density inferred from microwave patterns. Their agreement is not an identical experiment repeated twice; it connects different observations through a common model. [18] [15]
18A quarter by mass.
Say what is being counted before using a percentage.
The early-universe calculation predicts a helium-4 mass fraction around a quarter of ordinary matter, with most of the rest hydrogen. By mass is essential. A helium nucleus is roughly four times as massive as a hydrogen nucleus; the same percentage by number would mean something different. [18]
Ordinary matter here means matter built from particles such as protons and neutrons. The denominator is not the entire cosmic energy budget, including dark matter and dark energy. A percentage needs its denominator.
Observers study light from low-metallicity ionised gas regions. Astronomers call elements heavier than helium metals. Modelling and extrapolation help estimate the helium present before later stellar processing added more. [20]
Temperature, density, absorption, atomic emissivities and sample selection affect the result. Emissivity describes how much light a material emits under specified conditions. Aver and colleagues show how adding an infrared helium line helps constrain density and temperature more effectively.
The approximate agreement is substantial evidence. Calling the inferred fraction a direct, correction-free measurement would hide the work that makes it meaningful. I want the result together with its route and limits.
19The lithium problem.
The light elements do not all match equally well.
It would be convenient to say every predicted light-element abundance agrees perfectly with observation. That would be false. The cosmological lithium problem is a significant mismatch between standard predictions and the lithium inferred from certain old, metal-poor stars. [18]
At the matter density supported by other evidence, predicted lithium-7 is substantially higher, often by roughly a factor of three. The comparison depends on the observational and theoretical inputs. It is a real disagreement.
Stars are not sealed bottles of primordial material. Their surfaces may have lost lithium through internal processes. Nuclear inputs, stellar modelling and possible new physics are investigated. An explanation must survive those details.
The mismatch does not automatically cancel the deuterium measurement, the microwave spectrum and the expansion evidence. Neither does their success grant permission to dismiss lithium. We can have strong reasons for a broad history while a particular part remains unsolved.
If someone tells me science has a problem here, I agree. If they say the problem proves their scripture, I ask for the missing argument. A calculation failing to match one abundance does not identify an agent, a sacred text or an act of creation.
20The universe keeps a ruler.
An early sound pattern leaves a statistical trace in later structure.
Pressure waves travelled through the early hot mixture before matter and radiation largely separated. They left a characteristic scale in the distribution of matter. Baryon acoustic oscillations, or BAO, is the name for this sound-related pattern. [21]
Today the feature appears as a small statistical preference in separations between tracers such as galaxies. It is not a giant visible ring around every galaxy. Eisenstein and colleagues' 2005 SDSS analysis detected this feature in the large-scale correlation of luminous red galaxies.
The characteristic comoving scale is roughly 150 megaparsecs. A megaparsec is about 3.26 million light-years. Comoving means expansion has been factored out of the coordinate description; it is not an unchanging physical separation throughout history. [32]
Compare the pattern's apparent size across the sky and along redshift, and it constrains distances and expansion. Its calibration depends on early-universe physics. BAO is therefore a different observed pattern, not a completely assumption-free ruler handed down from outside cosmology.
DESI's 2025 analysis makes much more precise measurements with galaxies and quasars. The evidence is the measured clustering pattern and its fit under stated assumptions. Calling every galaxy pair exactly 150 megaparsecs apart would turn a statistical result into nonsense. [22]
21How do we get 13.8 billion?
A fitted expansion history is different from reading a cosmic birth certificate.
The familiar age of about 13.8 billion years comes from fitting cosmological observations with a physical model and calculating the elapsed time along its expansion history. It is not a timestamp directly printed on a photon. [15] [32]
The present expansion rate alone does not fix the answer. If expansion changed over time, tracing backwards requires that history. Simply dividing a distance by a present recession speed and calling the result an exact age skips that issue.
Matter, radiation, geometry and the assumed behaviour of dark energy affect the calculation. Microwave pattern measurements constrain combinations of these ingredients. Adding other datasets can tighten the inference or reveal disagreement. Different assumptions can change the resulting age.
That dependence does not make the number an arbitrary guess. A model has to reproduce multiple observations with the same fitted parameters. It cannot choose a separate universe for each measurement and then claim they all agree.
The quoted precision applies within a specified dataset and framework. It is not a guarantee against every possible revision of cosmology. I will use about 13.8 billion years while retaining the distinction between directly measured signals and the model-based age inferred from them.
22The Hubble tension.
Different estimates of today's expansion rate need a serious explanation.
Planck's 2018 analysis, published in 2020, inferred a present expansion rate around 67.4 kilometres per second per megaparsec within the standard flat model. Riess and colleagues' 2022 distance-ladder study reported 73.04, with uncertainty 1.04 in the same units. [15] [23]
The unit describes recession speed per unit distance, not a galaxy's acceleration every second. These dated results illustrate the Hubble tension; they are not a list of every estimate now published.
The early-universe inference and the distance ladder use different routes and assumptions. Hidden measurement effects, calibration choices or incomplete physical modelling could contribute. New physics is a possibility to test, not a prize awarded merely because two numbers disagree.
This disagreement challenges precise claims about the model and its parameters. It does not say galaxies have no redshift or that the microwave spectrum vanished. Distinguish a framework's broad successful history from a dispute about fitting its detailed expansion rate.
A headline cannot resolve the issue. A resolution should explain the discrepancy, survive other datasets and state what changed. Admitting the tension is part of taking the evidence seriously.
23Which age is that?
Separate distance, cosmic epoch and stellar age.
An article claims a star or galaxy is older than the universe. Before panicking, I ask which age was estimated, with which uncertainty, and whether the observations and cosmological conversion were actually independent.
The light's travel time is not the same as the age of the source when that light was emitted. The universe's age at that epoch is another quantity. The present distance can differ again because separation changed while the light travelled. [7]
Stellar ages are inferred from physical models of stars or populations, using features such as brightness, colour and composition. A galaxy's light can mix many populations. Dust, chemical abundance, star-formation history and active black holes can complicate the inference. [27] [29]
A photometric redshift uses brightness across filters; a spectroscopic redshift uses resolved spectral information. Candidates can change under better measurements. A genuine conflict should survive improved data, realistic uncertainties and the stated modelling choices.
This is a demand for a proper test, not a rule that the standard age must always win. If a robustly measured population could not fit within a model's available time, that would be evidence against that combination of assumptions. First show the actual comparison.
24Did Webb kill the Big Bang?
Surprisingly bright early galaxies are a serious question with a specific target.
JWST has found early galaxies brighter or apparently more developed than many expectations. Labbe's red candidate galaxies and Boylan-Kolchin's analysis illustrated how high inferred stellar masses could strain the standard framework. [27] [28]
Those arguments depend on the inferred redshifts, masses, abundances and efficiency of forming stars. A bright source is not automatically a measured stellar mass. Dust, stellar populations and emission associated with an active galactic centre can affect interpretation. [29]
It would also be wrong to claim every bright early galaxy is merely a disguised black hole. Carniani and colleagues spectroscopically confirmed two luminous galaxies around redshift fourteen and found their continua to be dominated by stars. The challenge cannot all be waved away that way. [26]
Ask what the models predict, how firmly the quantities are measured, and which revisions account for them. These 2023-2024 studies are concrete examples, not a list of the latest distance records.
An unexpected early population does not by itself explain away the CMB spectrum, time dilation and primordial abundances. A replacement history must address those too. I take the problem seriously without upgrading a difficult galaxy into a refutation it has not supplied.
25Faster than light?
A large recession rate is not a local object overtaking a light beam.
People sometimes hear that distant galaxies can have recession speeds greater than light and conclude expansion violates relativity. The objection mixes changing cosmological separation with a local speed measured beside an object. [7]
Relativity limits local motion through space. A large distance in an expanding spacetime can change at a rate above the speed of light without a galaxy locally racing past a neighbouring light beam. The definition of the distance and its rate matters.
That is why simply converting every large redshift into a special-relativistic Doppler speed is inadequate. Cosmological light propagation depends on the expanding geometry along the journey. There is no single universal distance formula to use without stating the model.
The observable universe is therefore not limited to a present radius equal to age times light speed. Light has travelled while distances changed. A present distance and a travel time should not silently be treated as the same kind of number.
None of this means anything at all is allowed. A model still has to calculate observable signals consistently. The point is to use relativity's actual distinction, then test its consequences, rather than rejecting a simplified picture that the theory did not require.
26Can dark energy change?
The late expansion model can face revision without erasing the hot past.
Dark energy names the component used to account for accelerated expansion; its ultimate nature remains unknown. Riess's and Perlmutter's supernova results were major evidence for acceleration under cosmological modelling. [24] [25]
The simplest description uses a cosmological constant: a component with constant density as space expands. Other models allow different behaviour. Observations must distinguish them. A label is not a complete physical explanation.
DESI's 2025 BAO analysis found preferences for changing dark energy when combined with other datasets. Their strength depended on the combination. That is not a universally settled discovery. [22]
In DESI's 2026 analysis of hydrogen absorption between galaxies, one component agreed with the standard model, but combined fits still preferred evolving dark energy. Full-shape uses more of the clustering pattern than BAO alone. The cited preprint refines the dispute; it does not settle it. [33]
The lesson is not that any change makes the whole subject worthless. More precise tests can expose which version works. We should keep hypotheses accountable to data and avoid claiming either eternal perfection or instant collapse whenever a fitted ingredient is challenged.
27Inflation is a further claim.
Do not give every early-universe idea the same certificate.
Inflation proposes an early period of accelerated expansion. It offers explanations for features such as large-scale uniformity and provides mechanisms for the initial disturbances that later become structure. There are many inflationary models, with different predictions. [30]
Some broad predictions fit observations well. That does not identify a unique inflation mechanism, a measured inflaton particle, or a complete history before the hot phase. A family of models is not one experiment that already selected every detail.
Certain models predict primordial gravitational waves, ripples of spacetime generated in the early universe. Their signal could leave a particular polarisation pattern in the CMB. Dust emission and other sources must be separated before such a claim can be made.
The cited BICEP/Keck 2021 study reported limits rather than a confirmed primordial-wave detection. It is one dated constraint, not a claim to give the latest bound. Ordinary gravitational-wave detections from merging compact objects do not automatically establish inflation. [31]
So my answer is specific: evidence for a hot early universe is not identical to proof of a particular inflation theory. We can investigate the latter without pretending the former waits on every unresolved detail. Keep both the progress and the distinction.
28Did everything come from nothing?
The observations do not establish that philosophical statement.
The hot Big Bang model does not, by itself, say that absolute nothing suddenly became everything. It describes a physical history and relates it to observations. A claim about the ultimate origin of existence is an additional question. [1] [32]
Push classical equations backwards far enough and they can indicate a singular limit. Infinite density in an extrapolation is not a measured tiny object we found in a telescope. It may indicate that the description has reached a domain requiring different physics.
What happened before? Whether there was an earlier physical phase, a boundary of time or another description remains unsettled. I will not assert that before is definitely meaningless merely because a familiar model uses a beginning in its time coordinate.
I also will not turn uncertainty into a specific creator. A cause, if one is proposed, needs argument for its existence and properties. Consciousness, intentions and identification with a particular religion do not appear automatically after the words we do not know.
Part 14 will examine causation, nothingness, time and the strongest creator arguments more carefully. Here I want the observational case kept in its proper shape. An evidence-based hot history and an answer to why existence exists are not the same achievement.
29Follow one chain properly.
Checking published evidence is possible without pretending to own a space telescope.
I can begin with the FIRAS archive linked here. Read the column descriptions, compare the plotted values with the file, and check how units were converted. That tests whether this chapter represents the published product accurately. It does not independently recalibrate COBE. [13]
Then open the original paper. Ask what the instrument compared, how foregrounds entered the analysis, which residuals remained and what uncertainties were reported. A processed dataset needs a documented route from measurements, not the false promise of having no assumptions. [12]
Try a different chain next: supernova timing, deuterium absorption or galaxy-pair clustering. Identify the signal actually observed and the model that connects it to the claim. Ask what a competing explanation would predict differently. [8] [19] [21]
Public data, methods and criticism make more independent checking possible. They do not guarantee every result is correct or every research group free from bias. Real independence means examining shared calibrations and assumptions, not merely counting names on papers.
I have not personally repeated every observation in this chapter. Rational confidence can come from transparent methods, cross-checks and a successful network of tests. If someone says science is just faith, I ask where the competing account exposes itself to comparable failure.
30How would I answer?
Explain the evidence clearly.
I would start here: our observable universe was once much hotter and denser, then expanded and cooled. That does not say scientists watched absolute nothing perform a magic trick. Now examine the evidence.
We measure spectral shifts and estimate distances using calibrated methods. We observe stretched supernova light curves. We measure a nearly thermal microwave background, small directional patterns and light-element proportions. The significance is how different observations constrain a shared history.
Ask which observation the person rejects and why. A calibration concern deserves an answer about calibration. A timing objection deserves the timing analysis. Saying where did God come from does not explain a spectrograph; saying scientists are arrogant does not explain a blackbody spectrum.
If asked whether the Big Bang is proven, I would say the hot expanding history has strong, converging evidence. Details, the earliest regime and ultimate origin have different uncertainties. That is not mathematical certainty against every imaginable scenario, and it is much more than a guess.
Does this prove there is no god? No. It does not prove someone's religious story either. My atheism does not need fabricated certainty. A claimant still needs evidence distinguishing their additional story from rival stories.
NoteLet the answer change.
Good explanations must stay open to correction.
This subject is often presented as a choice: pretend cosmology explains absolutely everything, or pretend its unanswered questions make a religious account automatically true. I accept neither performance.
These measurements have a history of wrong distance scales, instrumental corrections, model dependence and disagreements. Those belong here. So do the remarkable agreements. Hiding either side would make my argument less trustworthy.
My standards do not depend on the label atheist or believer. Either can make a sound measurement or repeat a bad headline. What matters is whether the evidence and inference survive serious criticism.
The comparisons and teaching examples are explanations, not observations. The figure replots a documented calibrated archive product. Reading the sources is not independently repeating every observation or reducing every instrument's raw data.
I remain unconvinced by religious accounts presented without adequate evidence. Cosmology does not need me to pretend its open questions are closed. I want explanations that survive questions. If better evidence requires a change, the honest response is to change the explanation, not declare it holy.
SourcesFollow the evidence.
Sources checked on 16 October 2026. Original observations, instrumental analyses, historical papers, institutional explanations and review syntheses are identified separately. Reading them is not independent repetition of all measurements or reduction of every raw dataset. The CMB figure replots the forty-three-bin NASA LAMBDA FIRAS monopole product. Its spectrum column is documented as a 2.725 K blackbody plus published residuals; it is not raw detector output. The lower panel shows those residuals and quoted one-sigma errors on a different scale. No new covariance-based fit or significance is claimed. Units are explicit. The wavelength and twenty-day event examples are invented calculations. Dated Hubble estimates, supernova timing, deuterium samples, model-dependent helium, the lithium discrepancy and uncertain early-galaxy interpretations retain their scope. Distances, travel time, source age and cosmic age are distinct. The 2026 DESI paper is a preprint. Inflation, the hot phase and an absolute beginning are not presented as equally established. No identification of a creator, creation from absolute nothing or final resolution of cosmological tensions is claimed.
[1] Webb Telescope & The Big Bang
NASA / John C. Mather / institutional explanation
Institutional explanation distinguishing a hot early universe from an explosion at a location, an absolute origin or a finished account of inflation. Not a primary observational dataset.
[2] The Big Bang
NASA Science / early-universe overview
Explains expansion, cooling, early nuclei and the later transparent era. Approximate model times are not direct timestamps or a photograph of time zero.
[3] Redshifts and distance
DESI Collaboration / spectra and distance explanation
Explains spectral features, wavelength shifts and distance interpretation. The 500-to-750-nanometre example in this chapter is invented arithmetic, not a measured galaxy.
[4] A relation between distance and radial velocity among extra-galactic nebulae
Edwin Hubble / PNAS 15 / 1929 / doi:10.1073/pnas.15.3.168
Original 1929 distance-velocity study; bibliography verified, full text inaccessible during this review. Its early distance scale was later corrected. Historical context is cross-checked against the NASA discussion linked under source 11.
[5] Periods of 25 Variable Stars in the Small Magellanic Cloud
Henrietta S. Leavitt; communicated by Edward C. Pickering / Harvard College Observatory Circular 173 / 1912
Historical variable-star period-brightness relationship. Absolute calibration and later corrections are separate steps; the original result was not already the complete modern distance ladder.
[6] Gaia Early Data Release 3: Parallax bias versus magnitude, colour, and position
L. Lindegren and colleagues / Astronomy & Astrophysics 649, A4 / 2021 / doi:10.1051/0004-6361/202039653
Parallax-bias analysis documents corrections depending on source properties and observing position. Geometry does not make real instrumentation free of systematic error.
Open the original paper or documented data
[7] Expanding Confusion: common misconceptions of cosmological horizons and the superluminal expansion of the Universe
Tamara M. Davis and Charles H. Lineweaver / Publications of the Astronomical Society of Australia 21 / 2004 / doi:10.1071/AS03040
Explains redshift, cosmological distance, horizons and recession faster than light. Mathematical cosmological recession is distinguished from locally outrunning a light beam.
Open the original paper or documented data
[8] The Dark Energy Survey Supernova Program: slow supernovae show cosmological time dilation out to z ~ 1
R. M. T. White and colleagues / MNRAS 533 / 2024 / doi:10.1093/mnras/stae2008
Analysis of 1,504 supernova light curves, reporting exponent 1.003 with 0.005 statistical and 0.010 systematic uncertainty. Comparability, band matching and selection matter. Calculated twenty-day examples are not the raw light curves.
Open the original paper or documented data
[9] A Measurement of Excess Antenna Temperature at 4080 Mc/s
Arno A. Penzias and Robert W. Wilson / Astrophysical Journal 142 / 1965 / doi:10.1086/148307
Original excess-antenna-temperature report near 4.08 GHz: roughly 3.5 kelvin with one-kelvin uncertainty. Not the later precise CMB temperature or a full-spectrum measurement.
Open the original paper or documented data
[10] Cosmic Black-Body Radiation
Robert H. Dicke, P. J. E. Peebles, P. G. Roll and D. T. Wilkinson / Astrophysical Journal 142 / 1965 / doi:10.1086/148306
Companion physical interpretation of the microwave background. The observational report and its cosmological explanation are separate contributions.
Open the original paper or documented data
[11] Evolution of the Universe
Ralph A. Alpher and Robert C. Herman / Nature 162 / 1948 / doi:10.1038/162774b0
Pre-discovery radiation estimate around five kelvin, cross-checked in the linked NASA historical presentation. The original publisher preview was accessible, but not its full article. The early estimate is distinguished from the later observed spectrum.
Open NASA's historical source discussion
[12] The Cosmic Microwave Background Spectrum from the Full COBE FIRAS Data Set
D. J. Fixsen and colleagues / Astrophysical Journal 473 / 1996 / doi:10.1086/178173
Original FIRAS full-dataset spectrum analysis, foreground modelling and residuals. The replot uses its archived calibrated product, not new raw-instrument reduction.
Open the original paper or documented data
[13] FIRAS CMB Monopole Spectrum
NASA LAMBDA / calibrated spectrum product and documentation
Archive explicitly constructs its spectrum column from a 2.725 K blackbody plus published residuals. Forty-three bins, units and quoted one-sigma errors are preserved. Full bin covariance is not supplied in this small table.
Open the original paper or documented data
[14] The Temperature of the Cosmic Microwave Background
D. J. Fixsen / Astrophysical Journal 707 / 2009 / doi:10.1088/0004-637X/707/2/916
Temperature assessment giving 2.72548 plus or minus 0.00057 K. This is distinguished from the 2.725 K reference used in the archived spectrum product.
Open the original paper or documented data
[15] Planck 2018 results. VI. Cosmological parameters
Planck Collaboration / Astronomy & Astrophysics 641, A6 / 2020 / doi:10.1051/0004-6361/201833910
Cosmological parameters inferred from Planck data within stated frameworks. Approximately 13.8 billion years and the early-inferred expansion rate are model-based results, not direct instrument readouts.
Open the original paper or documented data
[16] The Atacama Cosmology Telescope: DR6 Power Spectra, Likelihoods and Lambda-CDM Parameters
T. Louis and colleagues / ACT DR6 collaboration paper / 2025
ACT DR6 power spectra, likelihoods, systematic tests and standard-model parameter fits. A different instrument is not the same as every combined analysis being independent of Planck.
Open the original paper or documented data
[17] Microwave background temperature at a redshift of 6.34 from H2O absorption
Dominik A. Riechers and colleagues / Nature 602 / 2022 / doi:10.1038/s41586-021-04294-5
Water absorption at redshift 6.34 constrains the CMB temperature to 16.4-30.2 K at the reported one-sigma level. Gas modelling and broad uncertainty remain explicit.
Open the original paper or documented data
[18] Big Bang Nucleosynthesis
Particle Data Group / Review of Particle Physics / 2025 update
Review of nuclear reactions, observed abundances and the lithium problem. Deuterium and helium agree much better than lithium; the mismatch is retained rather than hidden.
[19] One Percent Determination of the Primordial Deuterium Abundance
Ryan J. Cooke, Max Pettini and Charles C. Steidel / Astrophysical Journal 855 / 2018 / doi:10.3847/1538-4357/aaab53
Seven selected systems yield D/H = (2.527 plus or minus 0.030) times 10^-5 in this 2018 analysis. The sample, line modelling and date are specified, not replaced by a universal direct count.
Open the original paper or documented data
[20] The effects of He I 10830 on helium abundance determinations
Erik Aver, Keith A. Olive and Evan D. Skillman / JCAP 07, 011 / 2015 / doi:10.1088/1475-7516/2015/07/011
Helium inference using emission-line physics, including the infrared He I 10830 line to constrain physical conditions. The result requires corrections and extrapolation; a mass fraction is not a number fraction.
Open the original paper or documented data
[21] Detection of the Baryon Acoustic Peak in the Large-Scale Correlation Function of SDSS Luminous Red Galaxies
Daniel J. Eisenstein and colleagues / Astrophysical Journal 633 / 2005 / doi:10.1086/466512
Original SDSS galaxy correlation measurement of the acoustic feature. A statistical separation preference is not a visible ring or identical separation for every galaxy pair.
Open the original paper or documented data
[22] DESI DR2 Results II: Measurements of Baryon Acoustic Oscillations and Cosmological Constraints
DESI Collaboration / Physical Review D / 2025
DESI DR2 BAO measurements and conditional cosmological fits. Preferences for changing dark energy depend on other datasets and the chosen model.
Open the original paper or documented data
[23] A Comprehensive Measurement of the Local Value of the Hubble Constant with 1 km/s/Mpc Uncertainty from the Hubble Space Telescope and the SH0ES Team
Adam G. Riess and colleagues / Astrophysical Journal Letters 934, L7 / 2022 / doi:10.3847/2041-8213/ac5c5b
Dated SH0ES distance-ladder result: H0 = 73.04 plus or minus 1.04 km/s/Mpc. Not a claim that every local method yields that number or that this is the latest estimate.
Open the original paper or documented data
[24] Observational Evidence from Supernovae for an Accelerating Universe and a Cosmological Constant
Adam G. Riess and colleagues / Astronomical Journal 116 / 1998 / doi:10.1086/300499
Supernova evidence for accelerated expansion using stated distance and cosmological modelling. It does not identify the microscopic nature of dark energy.
Open the original paper or documented data
[25] Measurements of Omega and Lambda from 42 High-Redshift Supernovae
Saul Perlmutter and colleagues / Astrophysical Journal 517 / 1999 / doi:10.1086/307221
Independent historical supernova-team analysis of acceleration. Shared astrophysical assumptions and calibration issues should still be examined.
Open the original paper or documented data
[26] Spectroscopic confirmation of two luminous galaxies at a redshift of 14
Stefano Carniani and colleagues / Nature 633 / 2024 / doi:10.1038/s41586-024-07860-9
Spectroscopically confirmed luminous galaxies around redshift fourteen, with stellar-dominated continua. Their brightness cannot all be dismissed as black-hole light; they are not claimed to be the latest distance record.
Open the original paper or documented data
[27] A population of red candidate massive galaxies ~600 Myr after the Big Bang
Ivo Labbe and colleagues / Nature 616 / 2023 / doi:10.1038/s41586-023-05786-2
Early red massive-galaxy candidates and model-dependent stellar masses. Candidate status, redshift and stellar-population assumptions matter to the inferred tension.
Open the original paper or documented data
[28] Stress testing Lambda-CDM with high-redshift galaxy candidates
Michael Boylan-Kolchin / Nature Astronomy 7 / 2023 / doi:10.1038/s41550-023-01937-7
Conditional argument that sufficiently high masses and number densities would strain standard cosmology. It is not a direct refutation of the measured microwave spectrum or every hot-history model.
Open the original paper or documented data
[29] Evidence for a Shallow Evolution in the Volume Densities of Massive Galaxies at z = 4 to 8 from CEERS
Katherine Chworowsky and colleagues / Astronomical Journal 168, 113 / 2024 / doi:10.3847/1538-3881/ad57c1
CEERS massive-galaxy analysis showing the importance of source interpretation and mass estimates. It does not establish that every early bright galaxy is an active black hole.
Open the original paper or documented data
[30] Planck 2018 results. X. Constraints on inflation
Planck Collaboration / Astronomy & Astrophysics 641, A10 / 2020 / doi:10.1051/0004-6361/201833887
Constraints on families of inflationary models. Agreement with some predictions does not identify a unique mechanism, an inflaton particle or an absolute creation event.
Open the original paper or documented data
[31] Improved Constraints on Primordial Gravitational Waves using Planck, WMAP, and BICEP/Keck Observations through the 2018 Observing Season
BICEP/Keck Collaboration / Physical Review Letters 127 / 2021 / doi:10.1103/PhysRevLett.127.151301
A dated upper-limit analysis for a primordial gravitational-wave signal, not a detection. Gravitational waves from merging objects are a different observation.
Open the original paper or documented data
[32] Big-Bang Cosmology
Particle Data Group / Review of Particle Physics / 2025 update
Physical review covering expansion, radiation, distance, ages and the standard cosmological framework. The framework and its assumptions are explicit rather than treated as direct readings.
[33] DESI DR2 Results IV: Alcock-Paczynski Measurements from the Lyman Alpha Forest and Cosmological Constraints
DESI Collaboration / preprint, revised 4 August 2026
DESI 2026 Lyman-alpha full-shape constraints; cited preprint revised 4 August 2026. A component measurement agrees with the standard model, while combined fits still prefer evolving dark energy. Neither a settled discovery nor a final dismissal is claimed.