

01You were not there.
The past leaves evidence without an eyewitness.
Someone says the Earth is billions of years old. A believer replies: were you there? No. Neither was the person claiming that a god made it a few thousand years ago. The useful question is what evidence survives now.
We already reason this way in ordinary life. A wet floor can show that something spilled before we entered. A photograph, a receipt, and a security recording can narrow down what happened. We do not need to have watched every event personally.
Of course, a wet floor alone does not tell us who spilled what. That is exactly the point. Evidence has a scope. A good investigation asks which explanation fits several clues and what else should be present if that explanation is correct.
I do not accept an ancient Earth because the word scientist sounds impressive. I want the clock, the material, the calculation, the possible mistakes, and the checks. A number without its method is a slogan waiting to be repeated.
This chapter builds that understanding from zero. We will separate the age of a crystal from the age of a burial, and the age of humanity from the age of writing. Mixing those questions is how a debate becomes confident nonsense.
02History has different scales.
The universe and a pot need different clocks.
A million is one thousand thousands. A billion is one thousand millions. The universe is about 13.8 billion years old in the standard cosmological model. Earth formed about 4.54 billion years ago. These are estimates of different events, using different evidence. [12] [13]
This chapter also examines evidence of life around 3.48 billion years ago, an early Homo sapiens site around 315,000 years ago, farming changes around 12,000 years ago, and a surviving writing tablet from about 3100-2900 BCE. None is a single universal birthday. [15] [16] [17] [19]
BCE means before the Common Era; CE uses the same year numbers as the familiar AD system. Bigger BCE numbers mean further back. About 3000 BCE is roughly five thousand years ago, not three thousand.
BP in conventional radiocarbon reporting means before AD 1950. It does not mean before the year you happen to read the paper. Cal BP means calendar years before that reference year, after calibration. Check the label before comparing numbers. [3] [4]
Think of a family album beside the history of the town. The oldest photograph in the album does not date the town, and the town does not date the planet. First ask what happened. Then ask how its time was measured.
03Which layer came first?
Find the order. Then add the numbers.
Imagine sediment settling in a quiet place. New material lands above older material. If those layers remain in their original arrangement, the lower layer formed first. That gives an order even before anyone assigns a number of years. [1]
Real ground can fold, crack, erode, or be dug into. So the rule is not lower always means older in every photograph. Geologists inspect the structure and ask whether the original sequence survives. Context is part of the evidence.
Suppose a fossil-bearing bed lies between two undisturbed volcanic ash layers. Date suitable crystals formed in each ash eruption. If the lower eruption was earlier and the upper eruption later, the fossil bed is bracketed between their ages. [1]
Those crystal dates do not require deciding the fossil's evolutionary position first. That answers one circularity objection: scientists need not assume the fossil's age to obtain every numerical date around it. Fossils can also help correlate layers, but that is a different operation.
My first questions at a dig would be ordinary ones: where exactly was this found, what lies above it, and could it have moved? A spectacular number cannot repair a specimen whose connection to its supposed layer has been lost.
04Atoms keep a physical clock.
Some nuclei change in a measurable way.
An atom has a central nucleus containing particles called protons and neutrons. Isotopes are forms of one element with different neutron counts. Carbon-12 and carbon-14 are both carbon; the numbers describe their nuclear makeup. [2] [5]
Some isotopes are unstable. Their nuclei transform, producing other nuclei and radiation. In dating language, the starting radioactive isotope is the parent; its decay product is the daughter. These are labels for a physical process, not miniature families.
A large collection of parent atoms changes at a characteristic statistical rate. Instruments measure quantities or isotope ratios. A calculation then connects those measurements with elapsed time, provided the sample's history satisfies the method's conditions. [5]
The clock is therefore not a scientist looking at a rock and guessing how old it appears. It is a relationship between measurable quantities and a tested physical process. The geological work decides which event that relationship can actually time.
Here is the important catch: an instrument does not print the entire history of the sample. It reports measurements. Interpreting them requires checking starting conditions, later disturbance, and measurement limits. Those checks belong inside the method, not hidden in tiny print.
05Half of what remains.
Two half-lives leave a quarter, not nothing.
A half-life is the time over which half the parent atoms in a very large collection are expected to decay. It is not a deadline given to each individual atom. We cannot name which particular nucleus will change next.
Use an ideal carbon-14 example with a half-life of about 5,730 years. Start with 100 percent of some original quantity. After one half-life, about 50 percent remains. After another, half of that remains: 25 percent. [2]
After three half-lives, it is 12.5 percent. After four, 6.25 percent. Each interval removes half of the remaining parents, rather than the same fixed number. That is why two half-lives do not mean everything is gone.
The next graph is a calculation of this pattern. It is not a graph of a newly tested fossil. We are temporarily assuming a known starting amount, constant decay, and no later additions or losses. Actual dating must investigate those complications.
You do not need advanced mathematics to understand the first step. Keep halving the remainder. But do not jump from this classroom example to claiming you can date any object using one percentage. The real work includes identifying the right sample and starting reference.
ModelHalf of what remains.
An ideal carbon-14 example: about 5,730 years per half-life.
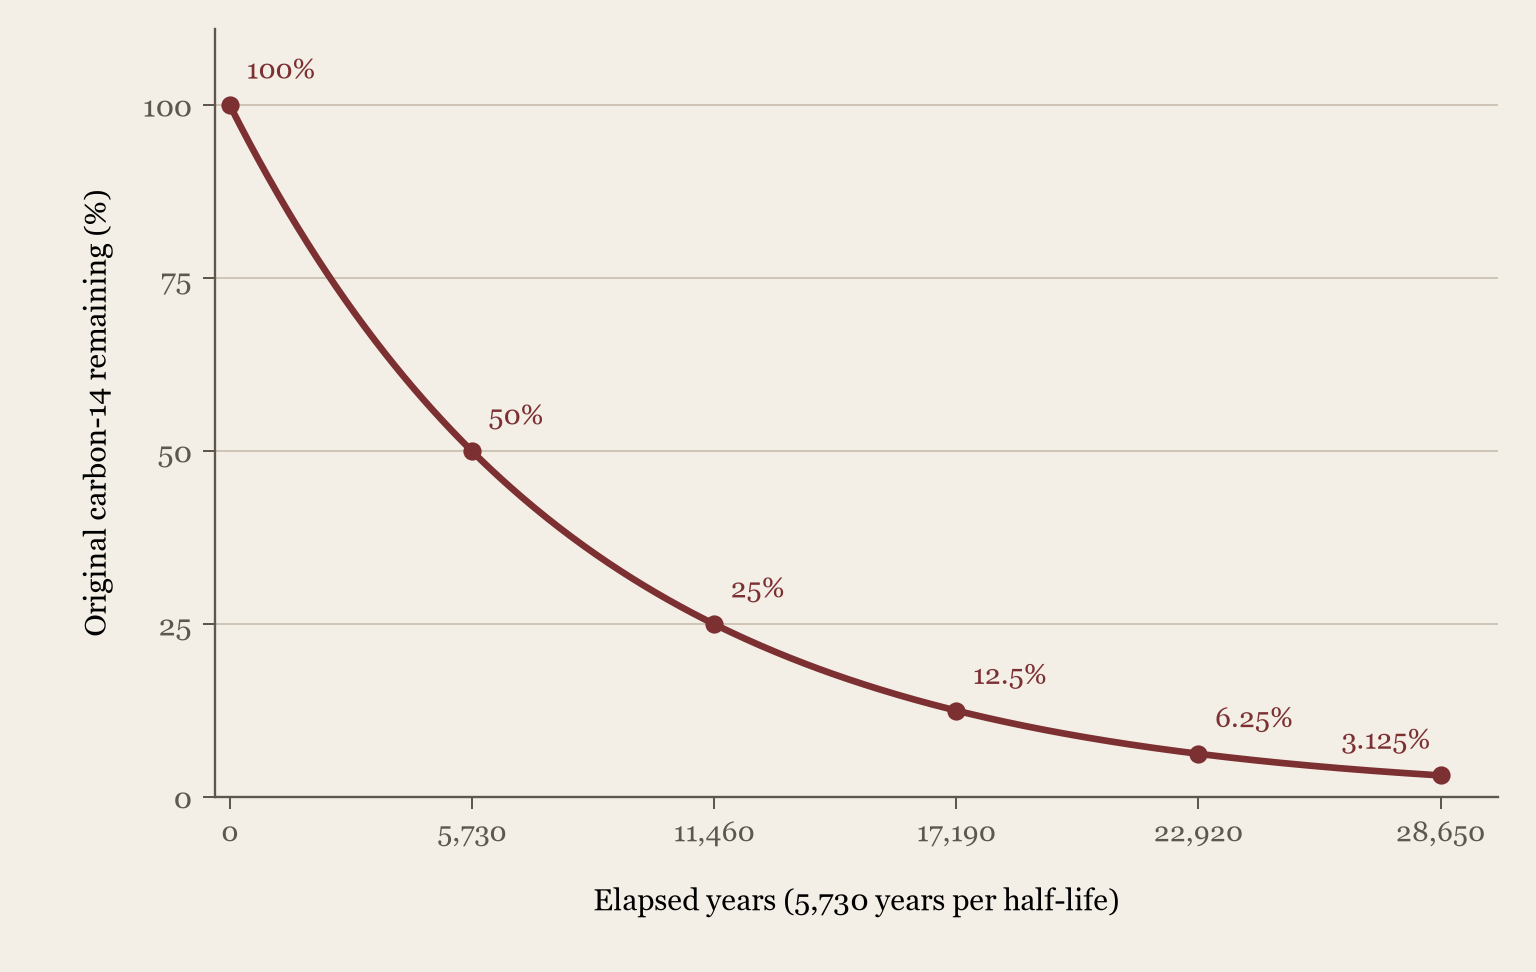
The curve assumes a known starting amount, a constant 5,730-year half-life, and no later gain or loss except decay. Each marked point halves what remained at the previous point.
A laboratory must also investigate the original reference level, contamination, background, and the event being timed. Conventional radiocarbon reporting and calendar calibration require further steps. Do not use this teaching graph as a dating calculator.
Download the calculated values
06Carbon has a limited range.
Match the material and age range to the question.
Plants take up carbon; animals obtain it through food. Once the relevant material stops exchanging carbon, its carbon-14 decreases. An animal's death and the formation of wood cellulose are examples of events that can start the useful dating interval. [2]
Radiocarbon dating is useful for suitable carbon-bearing material over roughly the last 50,000 years. The practical limit depends on the sample, preservation, preparation, and laboratory. By then the surviving carbon-14 is very scarce, and background becomes a serious problem. [3]
A stone wall is not automatically carbon-dateable. Charcoal in its construction layer might be. But that dates the carbon in the charcoal, with an additional argument needed to connect it to the wall. A direct measurement and an archaeological association are different steps.
Similarly, wood from the centre of a long-lived tree can be older than the moment someone cut that tree down. Reused timber can be older than its building. A result can correctly date the material while being misused to date the wrong event.
When someone asks how carbon dating proved Earth is billions of years old, my reply is straightforward: it did not. That is the wrong clock. Defending a method it was never meant to perform would only help the confusion.
07What was there at the start?
The atmosphere has not stayed exactly the same.
The amount of carbon-14 available to living things has varied. A raw radiocarbon result therefore cannot always be read directly as a calendar year. Calibration compares radiocarbon measurements with independently dated reference material and models of other suitable records. [4]
Tree rings are especially useful because a ring can have a calendar position established through overlapping ring patterns. Measure its carbon-14, then compare the radiocarbon reading with that calendar position. Repeating this builds a conversion curve.
IntCal20 is a published calibration curve for Northern Hemisphere atmospheric samples, extending to 55,000 calendar years before 1950. Its older portions combine different archives and their uncertainties. It is not a claim that one living tree has 55,000 rings. [4]
Another detail often causes needless accusations. Conventional radiocarbon ages retain a historical half-life of 5,568 years for consistent reporting, rather than the approximately 5,730-year physical value in our illustration. Calibration handles the reporting scale. The graph is not a laboratory calibration tool. [3]
A calibration curve can bend or flatten. One measurement may correspond to several calendar intervals. A careful report gives the range and probability information rather than pretending every sample has one perfectly exact year.
08Real samples can be dirty.
Contamination and reused material need checks.
Picture very old material acquiring a little recent carbon from soil, handling, or conservation treatment. That can make its apparent radiocarbon age younger. The smaller the original carbon-14 signal, the more seriously a small addition can matter. [3]
The opposite kind of problem also exists. Some organisms obtain carbon from sources that are already depleted in carbon-14. Marine and freshwater reservoir effects can make material look older than contemporary atmospheric material. A suitable correction needs evidence about the setting.
This is why laboratories clean and chemically prepare samples, measure backgrounds, and document procedures. Archaeologists also prefer material whose relation to the event is clear. A short-lived seed in a secure burning layer can answer a different question from an old roof beam.
The objection that contamination is possible is correct. The conclusion that all dates are therefore useless does not follow. Show which contamination occurred, how much it could shift this sample, and whether the preparation and cross-checks addressed it.
I would also reject an atheist who waved away every awkward result with the word contamination. That is a proposed explanation to test. It becomes persuasive through chemistry, controls, context, and repeat work, rather than through our preference for the final number.
09Older rocks. Slower clocks.
Different isotopes cover different age ranges.
Carbon-14 changes too quickly to remain a useful clock for Earth's formation. Other radioactive parents change much more slowly. Uranium-238, for example, has a half-life of about 4.47 billion years. The uranium-lead system is suited to much older material. [6]
A useful mineral is zircon. When many zircons crystallise, they incorporate uranium while admitting little ordinary lead. Later decay builds daughter lead inside them. Researchers measure the relevant isotopes and examine the crystal's structure and history.
There are two linked uranium clocks: uranium-238 ultimately produces lead-206, while uranium-235 ultimately produces lead-207. Their different rates provide a valuable comparison within the same mineral. Agreement is meaningful because an arbitrary disturbance need not preserve both relationships. [6]
Disagreement also carries information. Lead loss, inherited older zones, or later growth can complicate the result. A specialist may examine separate crystal regions rather than grind a mixed history into one misleading average. A crystal is sometimes a record with several chapters.
My short explanation to a believer is this: we use a slower clock for an older event, and we compare more than one relevant relationship. We then check whether the mineral actually preserved the event we claim to have dated.
10What was there already?
The initial daughter amount can be investigated.
If we mistake inherited daughter atoms for products of later decay, we can overestimate an age. So it would be foolish to describe all radiometric dating as assuming every daughter atom began at zero. That is not how all methods work.
An isochron approach measures several related samples or minerals with different parent proportions. It compares parent and daughter isotope ratios against another reference isotope. Under the method's conditions, the pattern can estimate both elapsed time and the initial daughter ratio. [5] [20]
Think of comparing several accounts rather than guessing the opening balance of one. The analogy is only a teaching aid: the actual calculation uses isotope ratios. The slope and starting intercept of the fitted relationship carry different information.
This is not assumption-free magic. The samples must share an appropriate formation history and initial isotope ratio, and preserve the relevant system. Mixing unrelated materials can sometimes imitate a line. A neat graph alone does not certify a true age.
Ask for the data, fit, uncertainty, and geological reason for grouping the samples. That is a much stronger challenge than claiming the initial amount is never investigated. The honest answer explains how it is estimated and how that estimate might fail.
11Old crystal. Young eruption.
An ingredient can be older than its surroundings.
Put an old brick into a new wall. The brick can remain old while the wall is new. Rocks can contain older mineral grains too. An inherited grain does not become newly born merely because a younger eruption or deposit carries it elsewhere.
Heat can also alter isotope systems. Some minerals lose particular daughter products more readily above certain temperatures. Cooling through an effective retention threshold can start the interval that a particular method records. The result may describe cooling rather than first crystallisation. [7]
That threshold is often called a closure temperature. It is not one universal switch for every mineral. Grain properties, the particular isotope system, and cooling history matter. Different clocks in one rock can legitimately record different events.
Later heating, fluids, or recrystallisation may partly or fully disturb a record. Researchers compare mineral textures, chemical patterns, and different systems to reconstruct what happened. They must justify that interpretation; the preferred story does not get a free pass.
When two numbers differ, first ask what each measured. One might concern an inherited crystal, another cooling, and another the sediment around it. Calling every difference a contradiction before identifying the events is like confusing someone's age with the age of their house.
12Clocks can give bad ages.
Known failure conditions are part of the subject.
A common debate claim says a historically observed lava flow returned an ancient radiometric age. Such problems are real. Dalrymple's 1969 study of historic lava flows reported excess radiogenic argon in several samples. This issue appears in the scientific literature itself. [8]
Some argon-based calculations assume an appropriate starting argon composition and subsequent retention history. Extra inherited argon can make the apparent age too old. Entrained older minerals can create a different problem. The exact sample and method determine which explanation is relevant.
A genuinely young sample may also lie outside the useful resolution of a particular measurement setup. Asking an unsuitable clock for a precise tiny interval does not test the same conditions as a well-characterised ancient mineral with a measurable accumulated signal.
But I cannot simply say every unwanted age is bad. The reasons must be visible: sample selection, gas behaviour, mineral inheritance, method limits, and comparison with the known eruption. Researchers should be able to explain the failure without choosing the answer first.
The right debate question is: does this failure apply to the particular evidence under discussion? A broken thermometer does not prove all temperatures imaginary. It does force us to inspect the instruments and conditions before trusting another reading.
13Trees keep a long record.
One very old tree is not required.
In suitable trees, annual growth leaves ring patterns. A run of narrow and wide rings can reflect shared conditions. Researchers compare overlapping patterns across many trees, including living trees, old timbers, and preserved wood. This is called cross-dating.
Imagine one record covering recent centuries and another overlapping its older end. A convincing match extends the sequence backwards. Many overlaps can carry it beyond the lifespan of any single tree. The match concerns a pattern, not just a ring count.
Friedrich and colleagues published a 12,460-year oak-and-pine chronology in 2004. It combined many pieces of wood. Their paper describes replicated regional sequences and checks on the links. It does not claim a single 12,460-year-old living tree. [9]
Missing rings, extra growth bands, and local disturbances require attention. A researcher cannot label every visible line one year and stop. Multiple trees and sites help test ambiguous stretches. The paper itself discusses revisions and problematic trees.
This gives the reader a concrete task: inspect how the overlaps were established and replicated. Then compare carbon-14 in calendar-positioned rings. That is a way to test and calibrate a dating method, rather than merely ask another authority to repeat its answer.
14Ice takes careful counting.
Every stripe is not automatically a year.
Snowfall can preserve changing seasonal chemistry and physical properties as ice builds up. Researchers drill cores and compare several signals to identify annual cycles. Melting, thinning, missing material, and ambiguous layers make the work harder than counting stripes in a photograph.
Svensson and colleagues' 2008 Greenland chronology extended annual layer counting to about 60,000 years. The study tracks uncertainty in doubtful layers. It does not pretend every year is equally easy to recognise or that the cumulative error is zero. [10]
Older ice records can also rely on ice-flow modelling and other dated markers. The published EPICA Dome C dataset used here extends about 800,000 years on the EDC3 timescale. Its data header explicitly records an age-model correction. [11]
That is a specific record, not a claim that all 800,000 years were individually counted by eye, or that it is the oldest ice ever studied. Also, trapped air can be younger than its surrounding ice because air is sealed in after snow falls.
To challenge an ice chronology seriously, ask how annual cycles were distinguished, where modelling entered, and how error accumulated. A single storm can make layers. That observation alone does not show that a multi-signal annual chronology confused every storm with a year.
15Check the checks.
Five copies of one calculation are still one.
Two laboratories can agree on a well-prepared sample. That helps test laboratory procedures, but not whether the sample belonged to the burial being dated. Both can inherit the same mistake about its context.
Now compare different evidence: a layer sequence, an appropriate isotope system, a tree-ring chronology, or a separately dated marker. These can constrain different sources of error. The strength comes from understanding their relationships, not merely counting agreeing headlines.
Some records are explicitly linked. Radiocarbon calibration uses tree rings and other archives. Ice chronologies can be matched through shared events. We should not describe every linked result as wholly independent evidence. Shared assumptions and shared calibration must remain visible. [4] [10]
The circularity accusation deserves this precise answer: numerical isotope measurements do not require first accepting an evolutionary family tree. But some geological correlations do use fossils. Identify the actual chain of reasoning instead of pretending all dating is either circular or completely disconnected.
My question is: if this particular assumption were wrong, which other observations should disagree? A good cross-check has a chance of exposing an error. A collection of results designed to agree would offer much less reassurance.
16Why 4.54 billion years?
The oldest rock is not Earth's birth certificate.
Earth continually changes its surface through melting, erosion, burial, and recycling. Many original materials no longer survive in their first form. Finding the oldest available Earth rock therefore does not automatically tell us when the whole planet formed.
The approximately 4.54-billion-year estimate draws importantly on lead-isotope evidence from meteorites and its relationship to terrestrial material. Meteorites preserve early Solar System history. The reasoning connects their formation history with the material from which Earth assembled. [12]
This is a reconstruction of planetary formation, not a carbon date of a fossil or a guess based on how worn a mountain looks. It also concerns an extended assembly process. Earth did not appear fully finished at one instant marked by a wall calendar.
The US Geological Survey's explanation reports uncertainty of less than one percent for the broad age estimate. Read that as an estimate within the method and evidence, not permission to claim we know the exact hour every part of Earth came together. [12]
A defender of a very young Earth needs to explain the relevant isotope patterns and geological history together. Pointing out that one loose rock is younger than the planet is no objection. We already expect rocks to form throughout a planet's later life.
17Why 13.8 billion years?
Cosmic observations constrain an expansion model.
The cosmic microwave background is faint radiation left from the early hot universe. Its temperature and polarisation patterns are measured; polarisation concerns the direction in which a wave oscillates. Cosmologists compare these patterns with predictions from mathematical models.
The Planck collaboration's standard-model analysis gives an age close to 13.8 billion years. Its table reports the age as a derived parameter: an answer calculated within the fitted cosmological model, not a stopwatch reading found on the spacecraft. [13]
The model includes ordinary matter, dark matter inferred through gravitational effects, and a cosmological constant associated with accelerated expansion. A model makes testable predictions. It earns confidence by matching observations; equations do not make it unquestionable.
Simply dividing one by today's expansion rate does not generally give the exact age. The rate of expansion changed through cosmic history. The age calculation must account for that history within the model, using the quantities constrained by observations.
This estimate does not prove what preceded the earliest phase our physics can describe. It does not prove creation from absolute nothing, and it does not identify a creator. Later parts will examine the observational case for the hot Big Bang more closely.
18Some questions remain open.
Each uncertainty has a particular scope.
Different approaches to the present expansion rate have produced a persistent disagreement called the Hubble tension. One route uses nearby distance measurements; another infers the rate from early-universe evidence within a model. NASA explains the problem openly. [14]
That matters. Researchers must investigate calibration, measurement bias, and whether the model needs revision. I would be dishonest if I presented cosmology as a completed book with no disputed measurements or assumptions.
But an unresolved difference between expansion-rate estimates does not show that all cosmic history is invented. We must ask how a proposed revision changes the age and whether it still fits the rest of the observations. A question is not a blank cheque.
Imagine two credible investigations disagreeing over which decade an old building was completed. That disagreement does not establish that it was built this morning. The analogy illustrates the logic only; it is not a numerical model of the Hubble tension.
My position is confidence with conditions attached: state the current model, its successful tests, and its difficulties. If a replacement explains the observations better, revise the conclusion. A preferred religious date still needs its own evidence rather than borrowing an unrelated dispute.
19Old evidence is not an origin.
Life existed by then. Its exact origin is another question.
Researchers examine ancient rocks for structures, chemistry, and environments that may preserve biological activity. A biosignature is a feature interpreted as evidence of life. The interpretation needs tests against non-biological ways of making a similar feature.
Djokic and colleagues' 2017 study reports biosignatures in approximately 3.48-billion-year-old hot-spring deposits of the Dresser Formation in Australia. This is a concrete site and research claim you can inspect, rather than the vague statement that scientists found something old. [15]
Two questions must stay separate. What is the age of the geological setting? What justifies interpreting the structures and materials as biological? A reliable age alone cannot turn a non-biological shape into a fossil. Both parts need support.
Even a convincing ancient biosignature tells us life existed by then. It does not tell us the exact first day life began, identify the first organism, or settle every proposed older trace. Different claims about the earliest evidence remain open to scrutiny.
I therefore say life has a history stretching billions of years into the past, while keeping the boundary of this example clear. How non-living chemistry produced the first life is another question. We will examine it in its own part.
20Humans came before writing.
A dated site does not identify the first human.
At Jebel Irhoud in Morocco, researchers studied fossils associated with early Homo sapiens and excavated stone tools. Richter and colleagues' 2017 dating study reported a weighted average of about 315,000 years, with an uncertainty of 34,000 years. [16]
The central measurement here was thermoluminescence dating of fire-heated flint. Some minerals accumulate effects of surrounding radiation over time. Heating can reset the relevant stored signal. Laboratory measurements and an estimate of radiation exposure are used to infer elapsed time since that heating.
This is not carbon dating a 315,000-year-old bone. The archaeological association connects the heated tools and the fossils. The paper also examines a tooth using a different combination of methods. Context and cross-checks matter to the interpretation.
An uncertainty of tens of thousands of years means the exact point is not fixed. It does not turn the result into a few thousand years. Still, this is not a claim that one individual suddenly became the first fully modern human on a particular Tuesday.
Species classification and the history of populations are biological questions as well as dating questions. We will return to them in the evolution chapters. For now, notice how badly the claim that humans began with writing confuses surviving records with the people who made them.
21Farming changed gradually.
Growing, storing, and domesticating differ.
Agriculture did not switch on everywhere at once. People could tend plants, manage animals, and store food before domesticated forms became clearly visible in their remains. Different regions and species followed different histories.
Zeder's 2008 review places early steps towards agriculture in the eastern Mediterranean around the twelfth millennium before 1950, roughly twelve thousand years ago. It describes management preceding some recognisable physical changes in domesticated species. This is a regional account, not a date for all humanity. [17]
Kuijt and Finlayson's study of Dhra' in the Jordan Valley describes purpose-built granaries around eleven thousand years ago, before fully domesticated plants there. Granaries store food. Storage alone does not mean the crop was already domesticated. [18]
Archaeologists combine structures, plant remains, animal remains, layers, and suitable dates. They ask what people were doing, not merely whether a grain looks old. A change in daily life is reconstructed from a pattern of evidence.
So the statement civilisation began twelve thousand years ago is too vague. Farming, settlement, cities, states, and writing are different developments. A simple explanation should separate them, not hide several complicated histories inside one impressive word.
22Writing came later.
Old evidence need not be the first example.
The Metropolitan Museum of Art catalogues a proto-cuneiform clay tablet from Mesopotamia at about 3100-2900 BCE. Its object number is 1988.433.1. The catalogue interprets it as an administrative account, probably involving grain distribution. [19]
That gives you something specific to inspect: the object, its date range, its signs, and the curator's explanation. The interpretation even has limits. The catalogue notes difficulty reading a writing system that lacks later grammatical features.
This tablet is not the birthday of thought, language, cities, or humanity. Those are different questions. Surviving writing from roughly five thousand years ago belongs to a much longer human history, including people who left tools and settlements rather than texts.
An archaeological date need not come from carbon in the object itself. For a clay tablet, researchers can use its context, associated evidence, and comparisons with dated material and writing styles. Ask what the catalogue's date is based on; do not silently invent a laboratory test.
Later religious writing also sits inside human history. The age of a manuscript, the proposed date of composition, and the date of an event it describes can differ greatly. A text telling a story about the beginning does not thereby become an eyewitness from the beginning.
23Read the error bar.
Precision and accuracy are different ideas.
Precision concerns how tightly a measurement or estimate is specified. Accuracy concerns how close it is to the thing being estimated. A badly calibrated scale can repeatedly give the same wrong weight. Repetition alone does not eliminate systematic error.
An error interval describes uncertainty under stated procedures and assumptions. Different reports use different statistical conventions. A one-standard-deviation interval and a 95-percent interval should not be treated as identical labels. Read which one the authors actually reported.
There are also uncertainties about context and interpretation. A laboratory can precisely measure an old piece of charcoal that was later moved into a younger pit. Its precise carbon result does not settle the pit's age without the archaeological connection.
This is why a useful report names the material, method, calibration, result, uncertainty, and dated event. A confident headline that drops all those details can mislead even when the underlying research was careful.
The proper response to uncertainty is to track it and test the assumptions. It is not to replace the measured range with any number a tradition prefers. To move the answer drastically, show a cause large enough and a model that still explains the evidence.
24A sacred date needs evidence.
Examine the claim being defended.
If someone claims the planet and all human history began only a few thousand years ago, that is a claim about the physical past. It conflicts with the much older records and dating evidence examined here. Calling the claim sacred does not repair that conflict.
Not every believer makes this claim. Some read creation accounts symbolically, accept an ancient Earth, or understand divine creation as compatible with natural history. I should criticise the actual chronology being defended rather than invent one shared by all religions.
But a literal claim cannot keep its status as accurate physical history after its defender retreats to metaphor. A meaningful metaphor may survive. The original numerical claim still needs evidence, and the change in interpretation should be admitted plainly.
An enormous number in a religious tradition is not automatically a successful scientific prediction either. Ask which event it dates, how clearly the number was specified before the discovery, and what measurement procedure could show it wrong. Big is not the same as correct.
I am blunt about this: a chronology does not get special treatment because someone worships its source. A scientific estimate must answer objections about its method. A religious estimate must meet the same demand for evidence about the world.
25A flood is not a reset button.
A replacement must explain the actual record.
Someone may propose that one flood made all the layers, or that decay rates were radically different in the past. These are proposals about physical events. They need to explain the isotope measurements, ordered sequences, preserved growth patterns, and the particular sites together.
A flood can deposit sediment. That does not establish that one flood produced every studied sequence, annual record, and geological history. Name the location and show how the proposed event produces its observed details. One familiar process is not automatically a complete global history.
Likewise, merely saying the rates changed gives no usable calculation. Which isotope changed, when, by how much, and with what consequences for the other measurements? A replacement must do more work than make one preferred number possible.
Another reply says the world was created recently with the appearance of an older past. If it deliberately reproduces every observation of an ancient world, observations cannot distinguish it from that ancient history. The proposal becomes untestable in this form.
I cannot logically disprove every invented past with fabricated memories and evidence. Neither can the believer use that possibility as positive evidence that their particular creation story happened. A possibility engineered to fit anything does not earn a factual timeline.
26Follow one sample.
Trace the path from material to conclusion.
Start with one concrete claim rather than the whole age of everything. For radiocarbon, ask for the sample identifier, material, find location, laboratory result, pretreatment, calibration curve, and calendar interval. Then ask which event the result actually dates.
For an ancient rock, ask which mineral and isotope system were measured. Look for the original ratios or data table, uncertainty, geological description, and the authors' checks for inheritance or disturbance. A rounded number in a debate video is not the complete evidence.
Open the references in this chapter. The ice dataset includes numerical rows and an explicit timescale. The Jebel Irhoud paper identifies the heated flints and their association. The tree-ring paper explains overlaps. Different claims have different documents to inspect.
Personal verification has levels. You can check an explanation, reproduce a published calculation, inspect raw data, or arrange a properly controlled independent measurement. Reading a graph is not the same as independently operating the instrument. Say which level you actually completed.
I depend on other people's expertise too. The reasonable alternative to blind faith is accountable trust: accessible methods, competent criticism, controls, replication, and correction. Demand those things from the scientific claim and from any rival account of the same past.
27Short replies. Real checks.
Teaching dialogues, not debate transcripts.
Believer: carbon dating cannot measure billions of years. Me: correct. That is why it is not the method used for Earth's formation. Let us examine the relevant lead-isotope evidence instead. Agreeing with a valid limitation makes the answer stronger.
Believer: a new lava flow gave an old age. Me: that can happen through documented sample and method problems. Which mineral, which method, what starting argon, and what useful range? Now show whether that problem applies to the particular ancient sample we are discussing.
Believer: someone found carbon-14 in material said to be millions of years old. Me: show the lab report, blanks, preparation, background limits, and provenance. A tiny signal near a method's limit is not automatically a reliable young age, and contamination is an explanation to test.
Believer: scientists keep changing the dates. Me: show the old and new results and what caused the revision. Better calibration, new context, and a corrected mistake are different situations. A revision should be explained; its existence alone does not validate your preferred date.
Believer: can you personally prove all this? Me: I can explain the evidence and checks I have examined, and show where further expertise is needed. I cannot honestly claim to have performed every measurement. Can your chronology survive the same scrutiny?
28The past does not owe us.
Let confidence follow evidence and its limits.
The case for deep history is not one number scribbled by one person. It includes ordered geological relationships, isotope measurements, overlapping growth records, archaeological contexts, and observations of the universe. Their strength depends on the particular tests and links, not on a vote.
Some questions remain unsettled. The exact beginning of life is not fixed by the oldest convincing trace. A cosmic age within a model does not explain why reality exists at all. Human populations do not have a single neat birthday. Those limits belong in the account.
None of that gives an unsupported recent creation story a scientific foundation. To replace a timeline, produce a better explanation of the evidence. Anger at the number, a sacred quotation, and an isolated faulty sample do not do that work.
My atheism does not require me to pretend scientists are infallible. I reject that attitude as readily as religious infallibility. The useful difference is whether a claim exposes its method to correction and whether the correction can actually change the conclusion.
I am willing to revise my understanding when the evidence warrants it. I am not willing to discard a long, testable physical history merely because it makes a treasured story uncomfortable. Belief does not decide how long the past was.
NoteWhy I explained the clocks.
Understand the answer you repeat.
Debates often trade dates without explaining them. One person says billions; another says scripture; neither follows a sample to the conclusion. A loud number is a poor substitute for understanding.
I am an atheist, but this chapter is not a certificate that every statement made by an atheist is true. If I use carbon dating outside its range, misdescribe an ice model as direct counting, or hide a real disagreement, I weaken my own case.
The cited studies are examples with stated dates and methods, not a claim to list every discovery or announce every current record holder. Older foundational work is used where its specific result remains relevant. Later research can refine these histories.
I have not performed these excavations or measurements. The graph is my explanatory calculation under stated ideal conditions. The sources identify the research. Imagined conversations show better questions without inventing personal experiments.
Next comes Part 7: What Evolution Actually Says. Before arguing about monkeys, missing links, or human origins, we need to understand what changes through generations and what common ancestry means. Knowing the timeline prepares us to examine the process.
SourcesFollow the evidence.
Sources checked on 15 October 2026. The references identify the particular methods, studies, dataset, and museum object used here. Relevant claims and methodological limits were checked; this is not an independent reanalysis of all raw measurements. Foundational studies retain their original publication dates and are not presented as current record holders. Linked sources can share calibration or assumptions, so they are not all counted as wholly independent tests. The half-life graph is an original calculated illustration using a rounded 5,730-year physical half-life, not measured sample data, an IntCal calibration curve, or a tool for converting conventional radiocarbon ages. Approximate dates, their events, and their limits are stated separately. Examples about floors, accounts, walls, houses, and imagined conversations are teaching aids. The criticism of unsupported chronologies is the author's reasoning; it does not claim that all believers share one chronology or that every remaining scientific question has been solved.
[1] Numerical dating of rocks and fossils
US Geological Survey / Fossils, Rocks, and Time
Explains numerical ages and bracketing fossil-bearing strata with dated igneous material. A layer sequence needs geological context; fossil correlation and numerical isotope dating are distinct operations.
[2] Improving carbon dating
ANSTO / 21 May 2014
Describes carbon uptake, wood cellulose, the approximately 5,730-year half-life, and measured atmospheric variation. Used for those principles, not to claim an ideal decay curve is a new experiment.
[3] Radiocarbon dating
Oxford Radiocarbon Accelerator Unit / method guide
Scope, approximate 50,000-year range, dated events, conventional reporting, calibration, contamination, and reservoir effects. A carbon age is not automatically the age of the object or event containing it.
[4] The IntCal20 Northern Hemisphere Radiocarbon Age Calibration Curve (0-55 cal kBP)
Reimer and colleagues / Radiocarbon 62 / 2020 / doi:10.1017/RDC.2020.41
Primary calibration paper. The curve combines archives with modelling and uncertainty; its 55,000-year coverage is not a tree's lifespan. Northern Hemisphere atmospheric scope does not cover every reservoir without adjustment.
[5] Isotope Geology: simple parent-daughter pairs
Pieter Vermeesch / University College London / Chapter 4
Explains parent-daughter measurements, radiocarbon, and isochrons. The isochron intercept can estimate an initial isotope ratio under the method's conditions; this is not a claim that all starting conditions are known without tests.
[6] Isotope Geology: the U-Pb system
Pieter Vermeesch / University College London / Chapter 5
Uranium decay chains, relevant half-lives, zircon, and comparison of uranium-lead systems. Disturbed systems need interpretation; disagreement is not automatically a usable formation age.
[7] Isotope Geology: thermochronology
Pieter Vermeesch / University College London / Chapter 7
Explains temperature-dependent retention and histories recorded by mineral clocks. Closure depends on the system and conditions; a cooling age need not equal the age of initial crystallisation.
[8] 40Ar/36Ar analyses of historic lava flows
G. Brent Dalrymple / Earth and Planetary Science Letters 6 / 1969 / doi:10.1016/0012-821X(69)90160-5
The original study's USGS abstract documents excess radiogenic argon in several historic flows. Used to acknowledge this specific failure condition, not to label all radiometric ages reliable or unreliable.
[9] The 12,460-Year Hohenheim Oak and Pine Tree-Ring Chronology
Friedrich and colleagues / Radiocarbon 46 / 2004 / doi:10.1017/S003382220003304X
Primary study of a replicated, overlapping oak-and-pine chronology. The 12,460 years describe the published sequence's full span, not one tree or a claimed current world record.
[10] A 60 000 year Greenland stratigraphic ice core chronology
Svensson and colleagues / Climate of the Past 4 / 2008 / doi:10.5194/cp-4-47-2008
GICC05 annual-layer chronology, uncertainties, and comparisons. The study uses years before AD 2000 (b2k), not radiocarbon BP's 1950 origin. About 60,000 years is rounded here.
[11] EPICA Dome C Ice Core 800KYr Deuterium Data and Temperature Estimates
Jouzel and colleagues / NOAA paleoclimate data contribution 2007-091 / 2007
Actual data file identifying the EDC3 timescale and an age-model correction. This particular approximately 800,000-year record is not described here as 800,000 individually counted layers or the oldest known ice.
[12] Age of the Earth
US Geological Survey / Geologic Time
Explains the approximately 4.54-billion-year Earth estimate and lead-isotope evidence from meteorites and terrestrial material. This older teaching page is used for that stable result, not its older estimates of other cosmic ages.
[13] Planck 2018 results. VI. Cosmological parameters
Planck Collaboration / Astronomy & Astrophysics 641, A6 / 2020; corrected preprint 2021
Tables 1 and 2 give an age near 13.8 billion years within the base flat Lambda-CDM model. The model and observational constraints matter. The result does not identify an ultimate creator or establish creation from nothing.
[14] Hubble Constant and Tension
NASA Science / Hubble mission
Explains differing expansion-rate estimates and the Hubble tension. Used to identify an unresolved measurement/model issue; no claim is made that one simple reciprocal gives the exact cosmic age.
[15] Earliest signs of life on land preserved in ca. 3.5 Ga hot spring deposits
Djokic and colleagues / Nature Communications 8, 15263 / 2017 / doi:10.1038/ncomms15263
Primary study of biosignatures in approximately 3.48-billion-year-old Dresser Formation deposits. Dating a setting and identifying biological evidence are distinct claims; this does not fix the first moment life arose.
[16] The age of the hominin fossils from Jebel Irhoud, Morocco, and the origins of the Middle Stone Age
Richter and colleagues / Nature 546 / 2017 / doi:10.1038/nature22335
Reports a weighted thermoluminescence age of 315 +/- 34 thousand years for heated flints associated with early H. sapiens remains, alongside other checks. It is not an out-of-range carbon date of a bone.
Open the authors' institutional paper PDF
[17] Domestication and early agriculture in the Mediterranean Basin: origins, diffusion, and impact
Melinda A. Zeder / PNAS 105 / 2008 / doi:10.1073/pnas.0801317105
Research review of regional domestication histories. Management and cultivation can precede the physical features used to recognise domestication. Roughly twelve thousand years is not a global single-day invention of farming.
[18] Evidence for food storage and predomestication granaries 11,000 years ago in the Jordan Valley
Ian Kuijt and Bill Finlayson / PNAS 106 / 2009 / doi:10.1073/pnas.0812764106
Primary archaeological study of granaries at Dhra'. Food storage and the local timing of plant domestication are distinguished. This is a particular site, not a universal date for all settlements.
[19] Proto-Cuneiform tablet with seal impressions
The Metropolitan Museum of Art / object 1988.433.1 / ca. 3100-2900 BCE
Museum object record, date range, and interpretation as an administrative account probably involving grain. The catalogue's qualified reading is preserved. No carbon test of the clay or first-ever writing date is invented.
[20] Errorchrons and anchored isochrons in IsoplotR
Pieter Vermeesch / Geochronology 6 / 2024 / doi:10.5194/gchron-6-397-2024
Primary methods paper on isochron estimation, scatter, uncertainty, and explicit external constraints. Used to explain that fitted isotope relationships have assumptions and checks, rather than certify every line as a date.